System Monitoring
Click the settings icon and select System Metrics to see the status of all machines managed by Canner Enterprise.

By default, the system fetches the latest monitoring data every 30 seconds in the background. When you open the System Metrics page, it shows the latest data fetched at that moment.
However, if you stay on this page for a long time, the page does not keep refreshing on its own. In that case, click the Refresh button in the upper-right corner to get the latest data.
Memory Usage History Chart
When you open System Metrics, you first see the Memory Usage History Chart, built from the last 24 hours of data. The chart shows:
- Usage history for the last 24 hours:
Thegreen lineshows Memory Capacity, on the left axis;
Theblue lineshows Memory Usage, on the left axis;
Theorange lineshows the memory utilization rate (Memory Peak), on the right axis. - Usage at a specific time: Hover over a point in time on the chart to see the memory figures for that time in the upper right.

Below the chart, the CPU, memory, and machine information at the latest reported time (Reported Time) is shown.
- CPU Usage: Current CPU usage / total available CPU; the green number is the resulting CPU utilization.
- Memory Usage: Current memory usage / total available memory; the blue number is the resulting memory utilization.
- Nodes: The number of machine nodes currently running.
- Pods: The total number of containers currently running on the machines.
When a machine's CPU Usage or Memory Usage reaches 90% or higher, a warning is shown in the corresponding section.

Nodes and Pods information
Select a Node
First, select the machine node (Node) whose details you want to see.
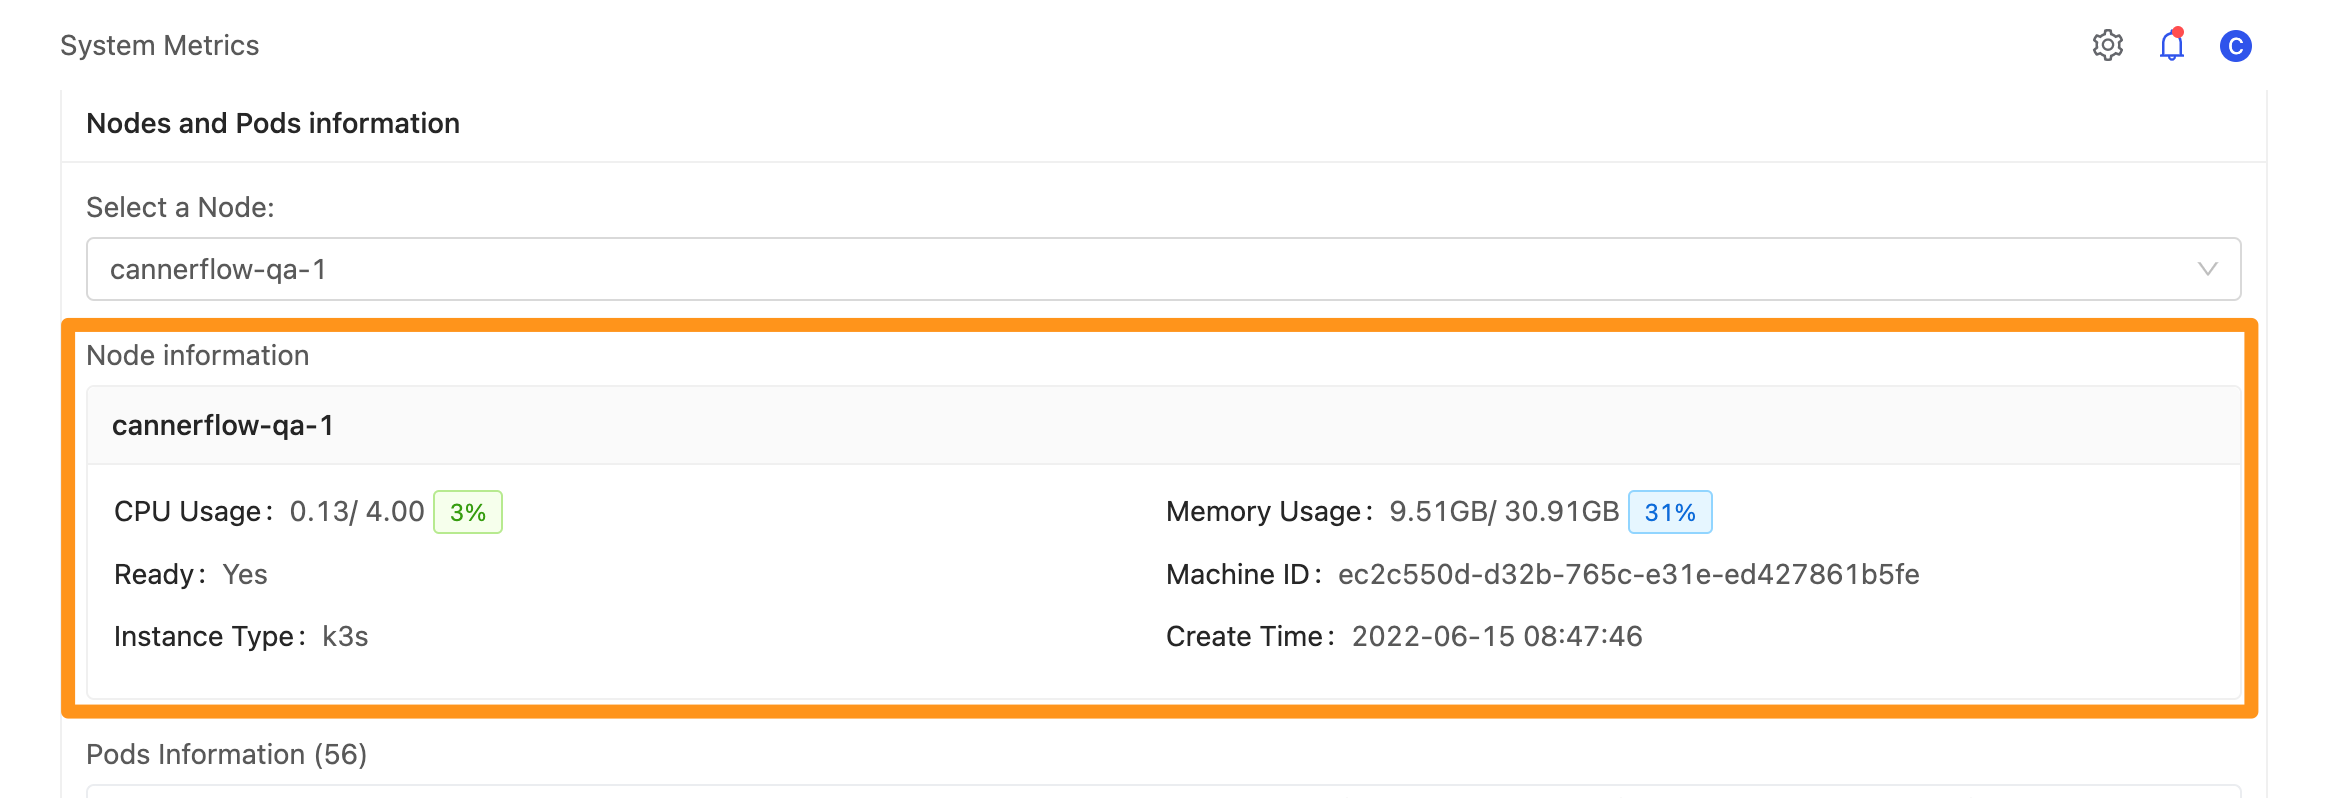
Node information
Shows the selected node's name and the following information:
- CPU Usage
- Memory Usage
- Machine ID
- Creation time
- Instance Type
Pods Information
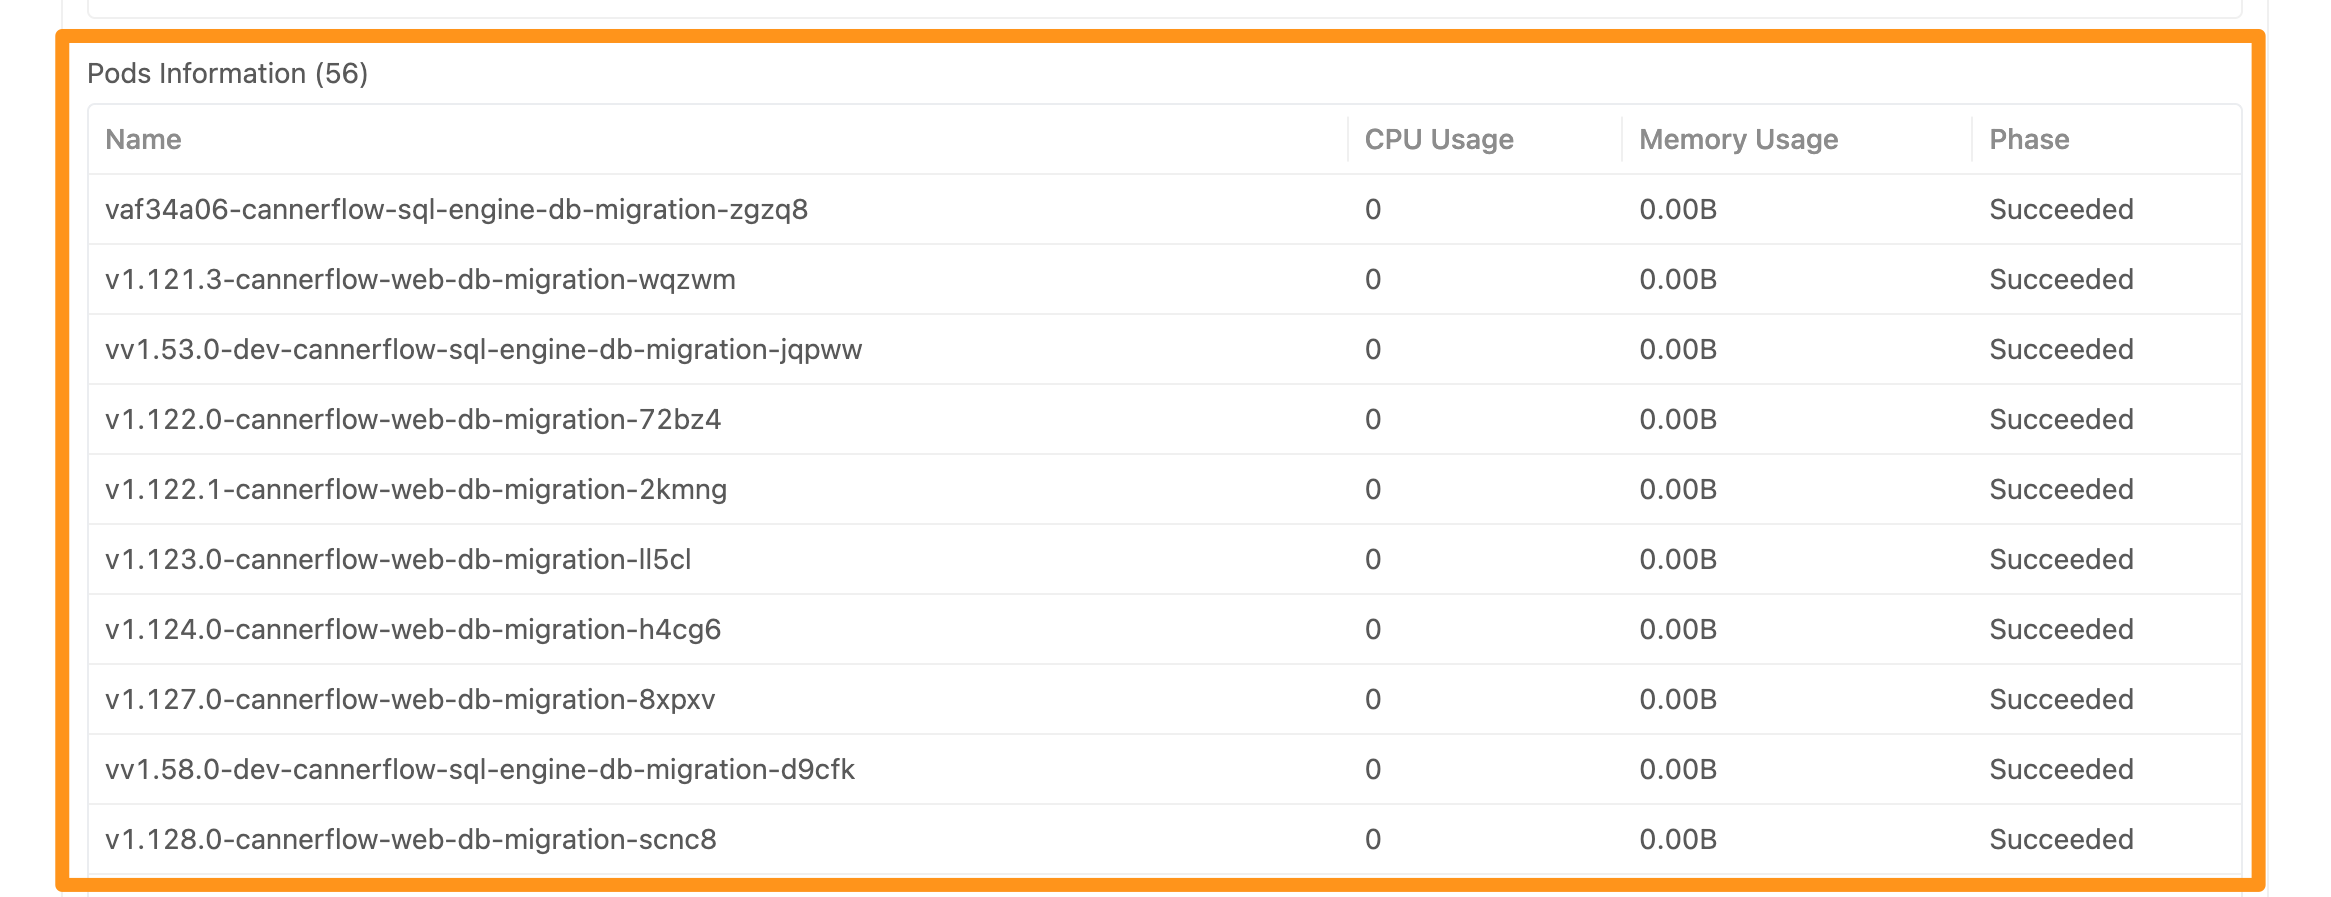
Lists the containers (Pods) on the selected node:
- CPU Usage
- Memory Usage
- Status (Phase)