2.4.3 SQL Editor
The SQL Editor is one of the features data analysts use most in a workspace. It lets you immediately design all the combined reports and queries you need.
Write SQL statements
- The upper area is where you write SQL statements. Write queries using ANSI SQL syntax. See ANSI SQL syntax.
- Run: Runs the SQL statement and shows the result in the All Queries tab below. See "SQL execution results" in this chapter. Click the down arrow on the right to show the Use cached results option, which is enabled by default.
info
Use cached results: The system provides a cache for SQL by default. Each query reads from the cache layer first. If you turn this off, the system reads the most up-to-date data.
The default cache expiration is 7 days.
- Save icon: Hover over the icon to show a menu with Materialized View / View / Query.
- Materialized View saves the SQL statement as a Materialized View dataset, which you can find and use on the workspace Datasets tab in the Data Catalog module.
- View saves the SQL statement as a View dataset, which you can find and use on the workspace Datasets tab in the Data Catalog module.
- SQL saves the SQL statement as a Saved Query, which you can find in the Saved Queries tab below. It does not appear on the workspace Datasets tab in the Data Catalog module.
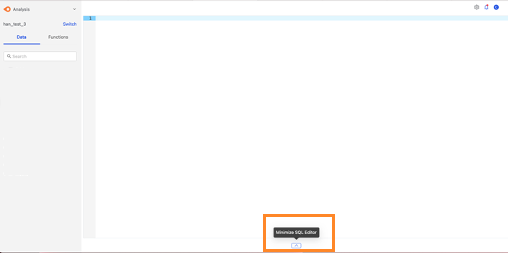
- Maximize SQL Editor icon: Enlarges the SQL writing area. Click the Minimize SQL Editor icon to return to the normal view.
- Clean icon: Clears the SQL statement in the upper area.

SQL execution results
Click Run to query your SQL immediately. The columns are described below. For how long execution results are stored, see 2.8.2 System Settings / Storage Management.

- No: The sequence number of the SQL execution.
- Query: The SQL statement of each execution.
- Progress: Execution progress. Blue means in progress, green means completed, red means a warning.
First circle: Number of input rows.
Second circle: Processing stage.
Third circle: Number of output rows.
Single red circle: The query failed or expired.failedmeans the query failed; the Result column also shows a warning icon, which you can click to see the error.expiredmeans the query record has expired and its execution progress can no longer be viewed. For the default retention period, see Storage Management. - Duration: Execution time. Hover over it to see execution details such as the start time, as shown below:

- Count: Number of result rows
- Action: Available actions
- Use: Puts the query (SQL statement) into the SQL writing area above
- Cancel: Cancels a running query
- Result: The three icons do the following:
(1)Magnifying glass: View the query (SQL statement) result.
(2)Attachment icon: Requires permission from the workspace Owner. Submits a download request; after approval, you can download the query result as a CSV file. See Download CSV.
(3)Table icon: Save the query as a Materialized View.

The progress bar shows overall execution status.
- Running Queries: The number of queries currently running. Returns to 0 when all finish.
- Queued Queries: The number of queries waiting. They run once resources are available.
- Memory: The percentage of memory currently in use.
