System Metrics
Canner Enterprise system status You can check the status of all current machines managed by Canner Enterprise in "System Metrics".
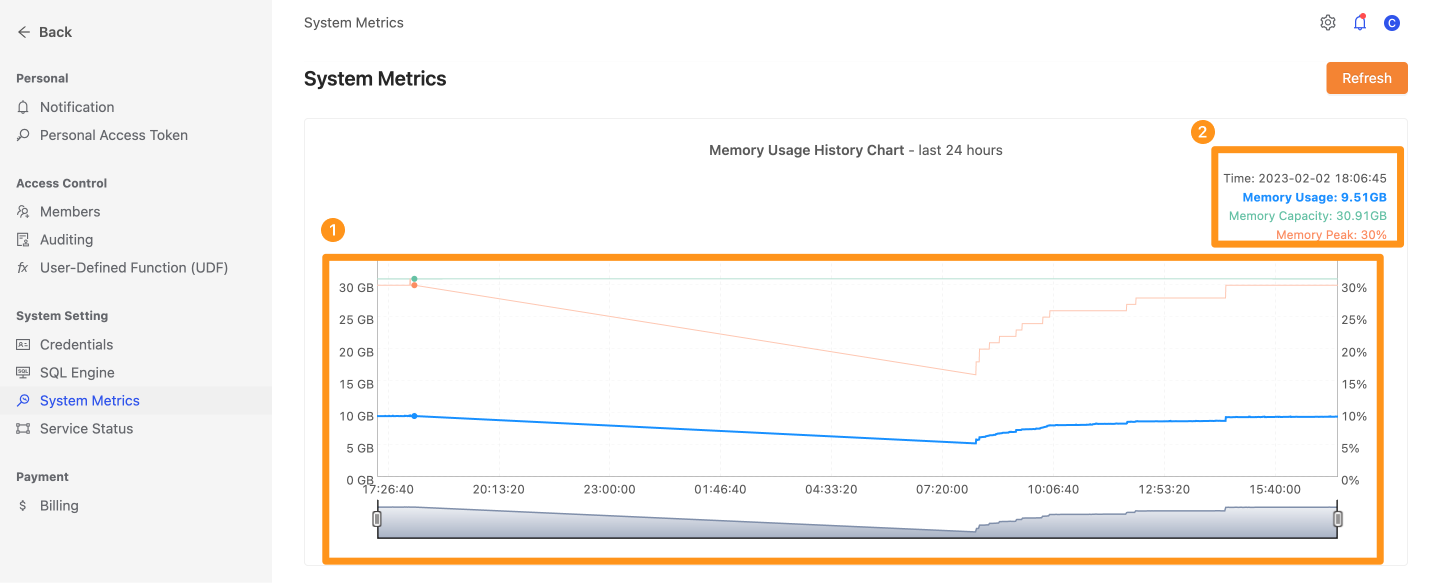
Once you enter "System Metrics", you will first see the "Memory Usage History Chart" chart generated from the data of the last 24 hours.
Historical usage records
Detailed usage at each period
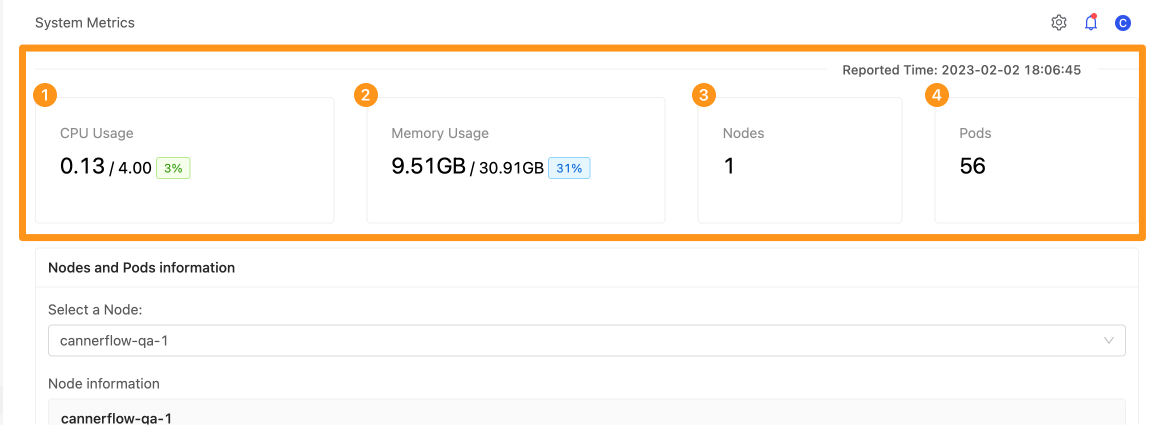
Below the chart is the time of the latest reported time and detailed information about the machine
The statistical information and the detailed information of Nodes and Pods can be, respectively, and the four sections of the statistical data are:
1. Current CPU usage/ total CPU and CPU usage
2. Current Memory Usage/ Total Memory and Memory Usage
3. The number of machine nodes currently running
4. The total number of all Pods containers now
You can quickly see the average CPU and Memory usage of these Nodes. For example, there is a total of 128G RAM, of which Nodes use a total of 30G, and the usage rate is 30/128 = 23.4%.
In addition, if the machine's CPU or Memory usage exceeds 90%, the system will display a warning reminder in the corresponding CPU Usage/ Memory Usage block.
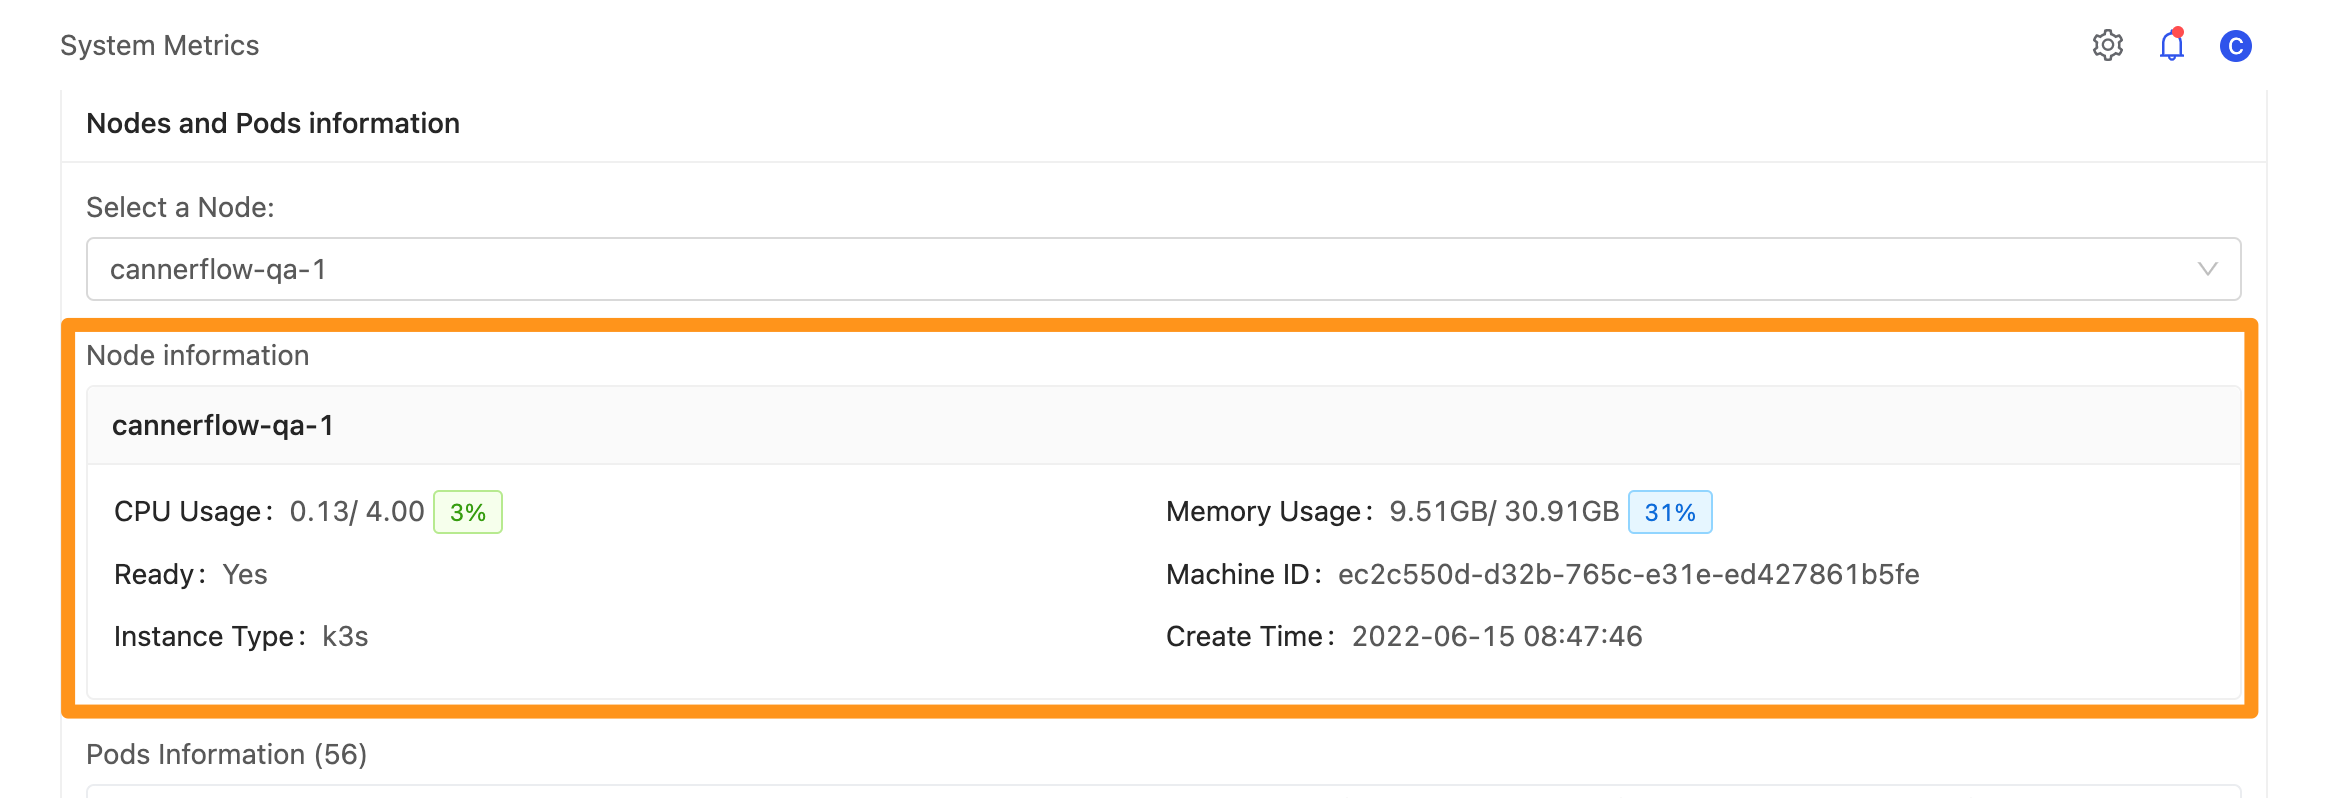
The "Nodes and Pods information" will list the machine node's name that you can view according to this period. The selected machine node name (Node) will display the machine node's information and the relevant container (Pods) information list.
##Node information
The machine node name (Node) and information you selected will be displayed as follows:
- Processor-related usage (CPU Usage)
- Memory usage (Memory Usage)
- Machine identification name (Machine ID)
- Build time
- Execute the individual type (Instance Type)
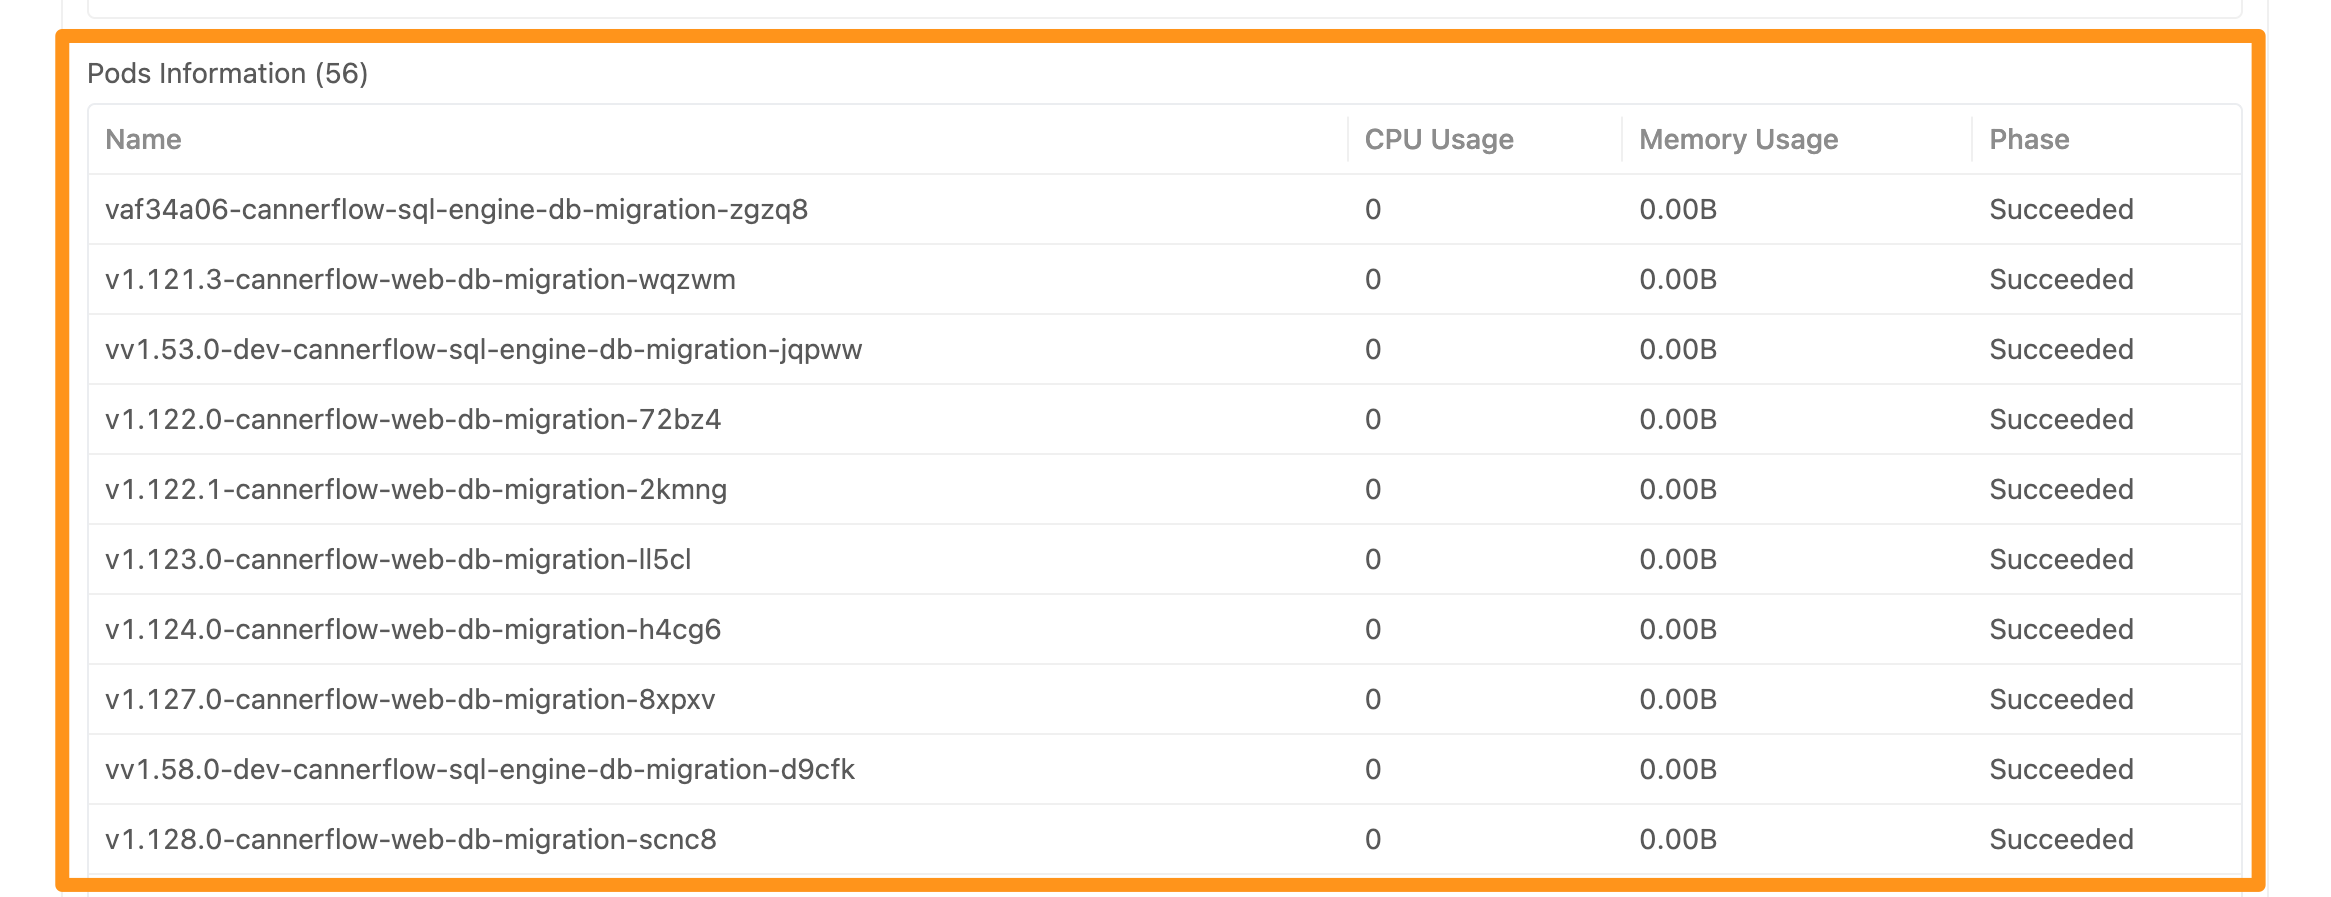
Pods Information
According to the machine node (Node) you selected, a list of related container (Pods) information will list out:
- Processor-related usage (CPU Usage)
- Memory usage (Memory Usage)
- Execution status (Phase)